Top 10 Countries of Origin
Imports (2022‑2024) – The Philippines’ import basket remains dominated by East Asian suppliers, with China leading the pack at $29.8 bn in 2022, climbing to $34.5 bn in 2024 (+ 15 %). Indonesia follows, though its share fell from $13.9 bn to $11.3 bn, reflecting a modest contraction. Japan’s imports dropped sharply from $13.1 bn to $10.7 bn, while South Korea’s volume contracted then rebounded, ending at $10.0 bn in 2024. The United States, Thailand, Malaysia, Singapore, Vietnam, and Taiwan (China) round out the top ten, collectively accounting for roughly 70 % of total import value. The overall trend points to a growing reliance on Chinese goods, offset by a gradual diversification toward regional partners.
Top 10 Countries of Origin
Imports 2022 (Million US$)
Imports 2023 (Million US$)
Imports 2024 (Million US$)
Ch
29,796
30,934
34,491
Indonesia
13,936
12,284
11,291
Japan
13,086
10,921
10,671
South Korea
12,730
8,880
10,020
The United States
9,662
9,086
8,816
Thailand
7,656
8,187
7,796
Malaysia
6,681
6,235
6,239
Singapore
8,461
7,388
6,018
Vietnam
4,773
4,975
5,724
Taiwan, China
7,094
4,932
4,1
Top 10 Countries of Destination
Exports (2022‑2024) – The United States continues as the chief destination, albeit with a slight dip to $12.1 bn in 2024 after a low of $11.4 bn in 2023. Japan remains a strong market, holding steady around $10.3 bn. Hong Kong (China) and China itself are key Asian outlets, together contributing over $19 bn in 2024, though China’s share slipped to $9.4 bn from $10.9 bn in 2022. South Korea, Thailand, Singapore, the Netherlands, Taiwan (China), and Germany complete the top‑ten list, together representing roughly two‑thirds of export earnings. While traditional markets retain prominence, the data hint at a modest shift toward diversified Asian and European destinations.
Top 10 Countries of Destination
Exports 2022 (Million US$)
Exports 2023 (Million US$)
Exports 2023 (Million US$)
The United States
12,461
11,412
12,056
Japan
11,094
10,425
10,254
Hong Kong, China
10,480
8,773
9,600
China
10,966
10,648
9,423
South Korea
3,127
3,479
3,564
Thailand
3,374
2,930
2,954
Singapore
4,909
3,521
2,935
NetherLands
2,941
3,085
2,867
Taiwan, China
2,965
2,629
2,676
Germany
2,779
2,479
2,456
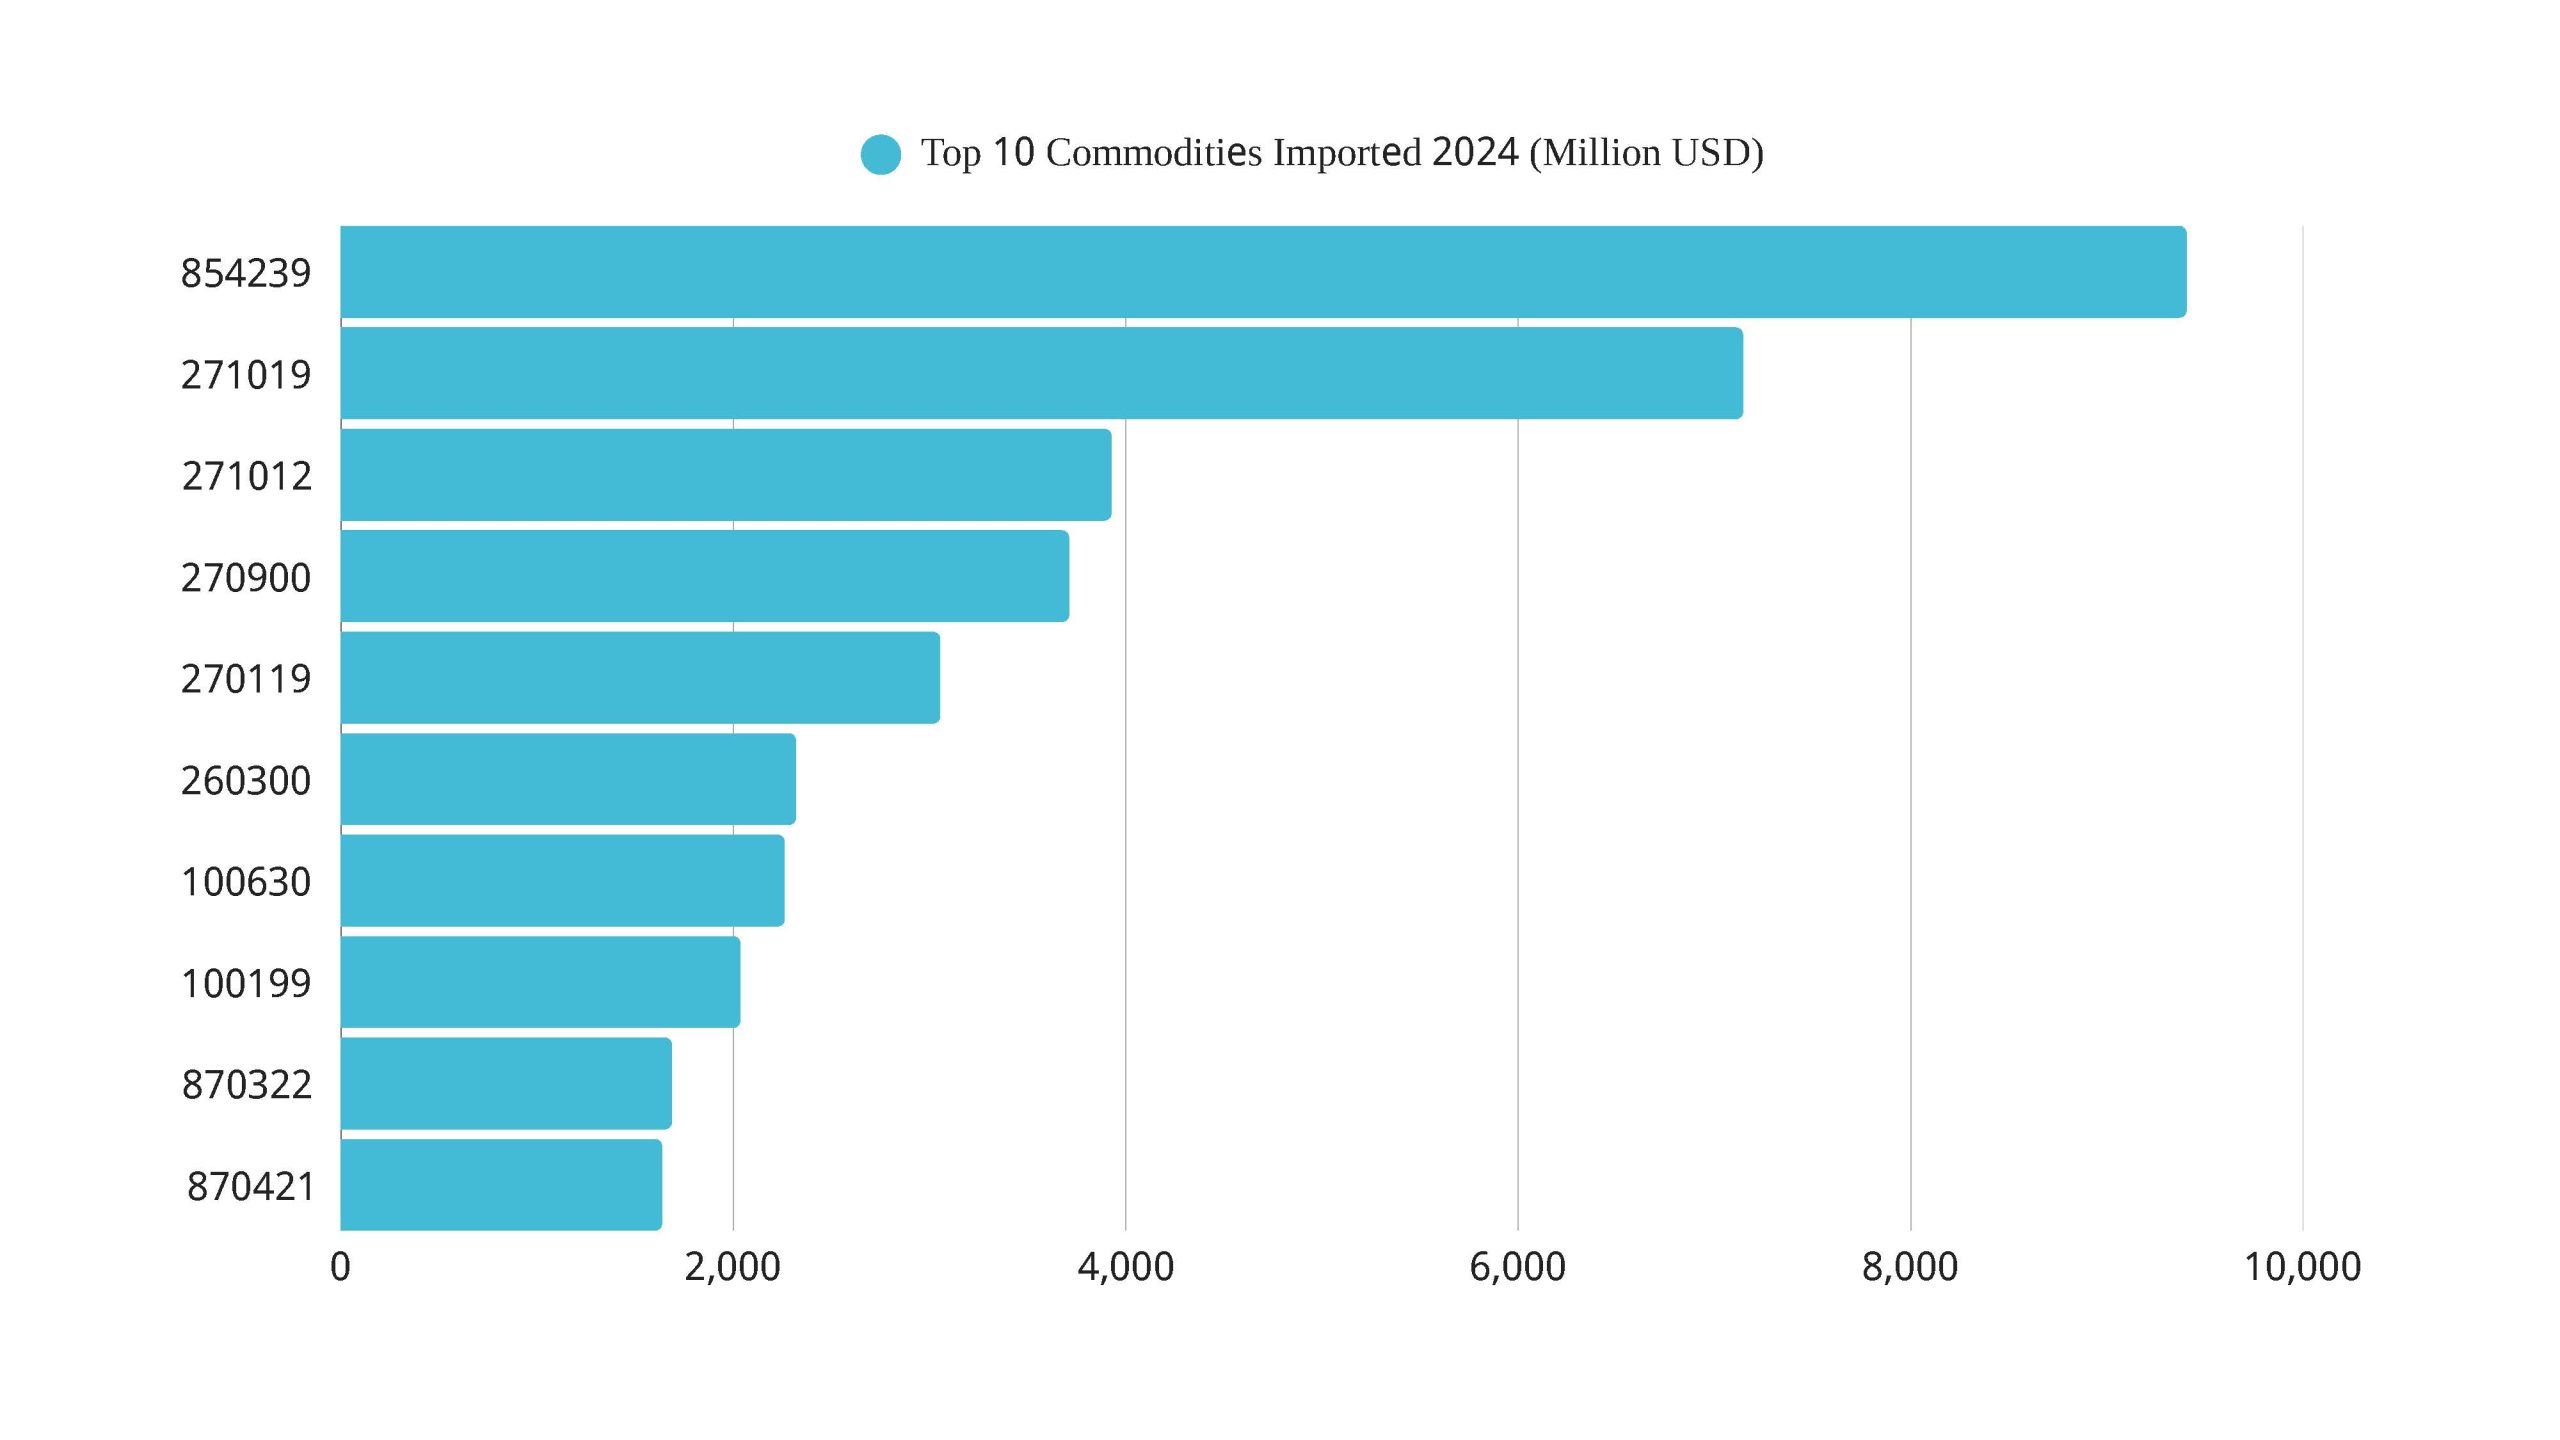
Top 10 Commodities Imported 2024
The distribution of import values points to a highly concentrated manufacturing‑supply chain. China’s dominant $34.5 bn share reflects massive inflows of electronic components, consumer appliances, and intermediate machinery parts. Indonesia ($11.3 bn) and Vietnam ($5.7 bn) supply primarily raw commodities—palm oil, rubber, and agricultural staples—that feed downstream processing. Japan ($10.7 bn) and South Korea ($10.0 bn) contribute high‑tech equipment, automotive parts, and precision instruments. The United States, Thailand, Malaysia, Singapore and Taiwan (China) together account for the remaining 30 % of imports, largely consisting of specialty chemicals, refined petroleum products, and niche electronic assemblies. Overall, the Philippines’ import basket is overwhelmingly oriented toward finished and semi‑finished manufactured goods from its East‑Asian neighbors, with a modest but essential flow of primary commodities from Southeast‑Asian producers.
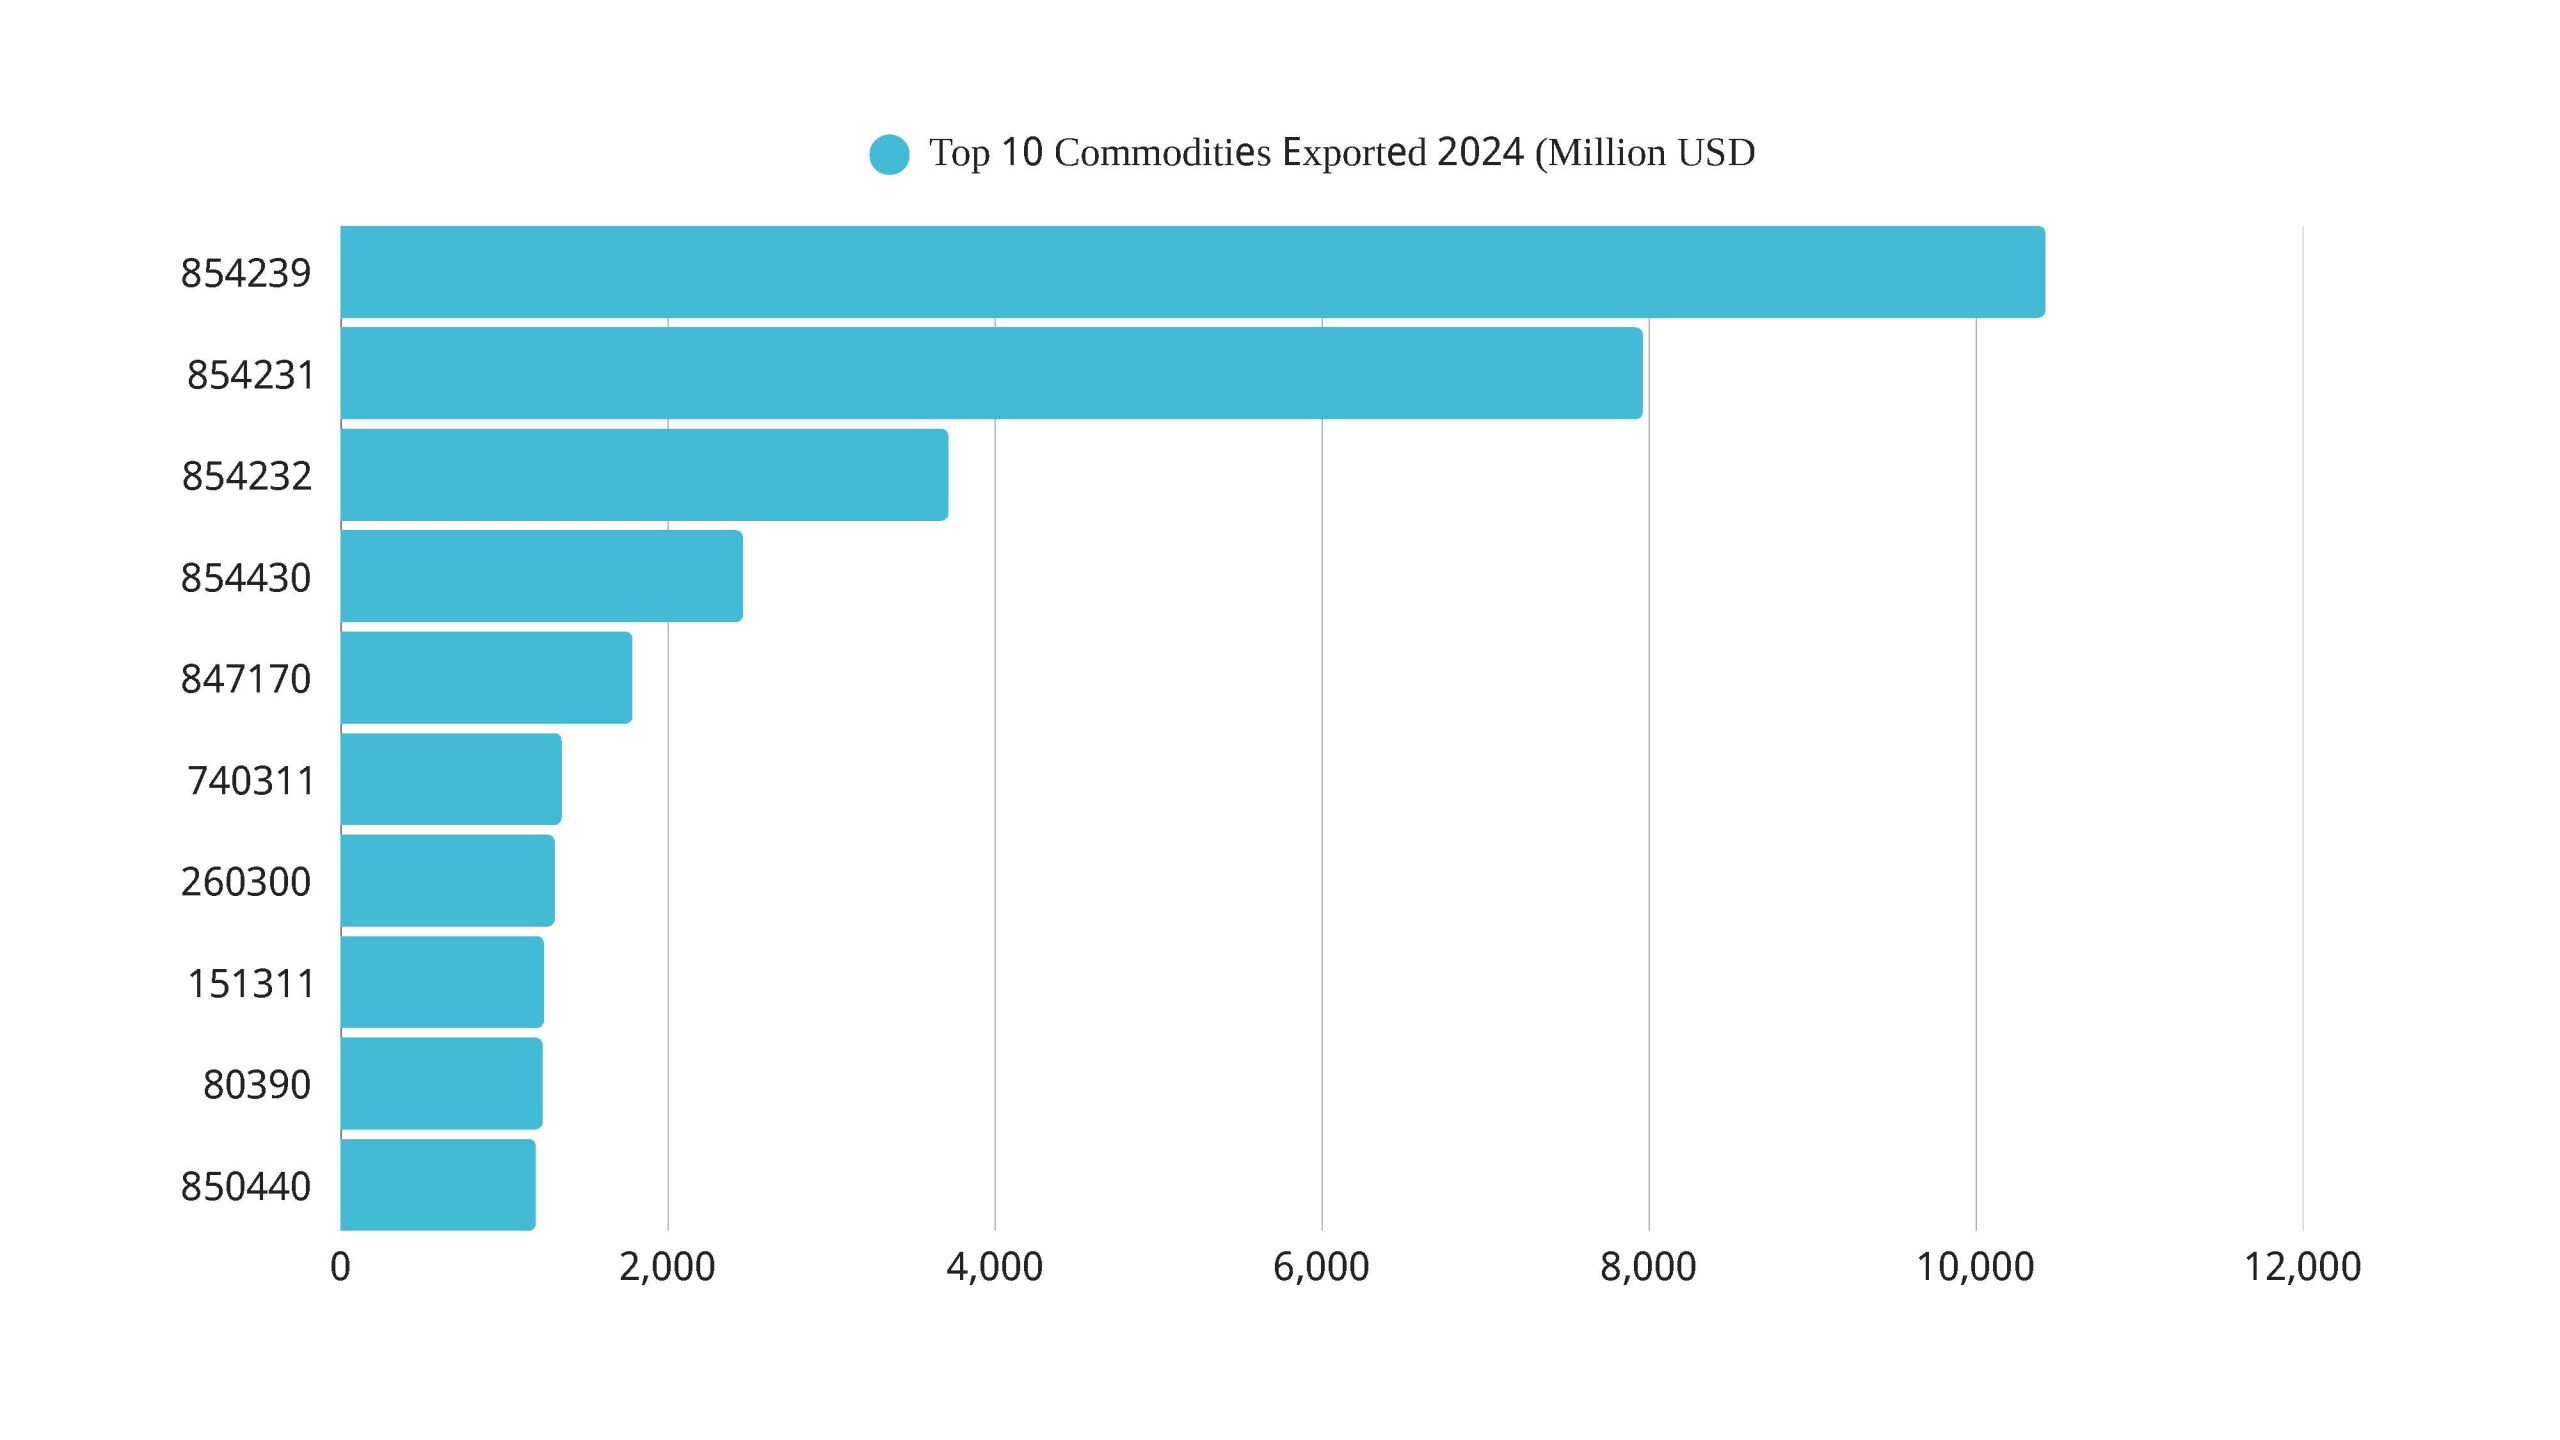
Top 10 Commodities Exported 2024
Export revenues are similarly focused on high‑value manufactured output. The United States ($12.1 bn) and Japan ($10.3 bn) absorb the bulk of Filipino electronics, semiconductor‑related hardware, and value‑added processed foods. Trade with Hong Kong and mainland China (~$19 bn combined) is driven by agricultural exports—seafood, tropical fruits, and coconut products—as well as re‑exported electronics. South Korea, Thailand, Singapore, the Netherlands, Taiwan (China) and Germany each receive between $2.5 bn and $3.5 bn, predominantly in electronic devices, computer peripherals, and select petrochemical derivatives. The export profile therefore underscores a dual strategy: supplying sophisticated electronic and tech‑manufactured goods to advanced economies while leveraging the country’s comparative advantage in agricultural and marine commodities for regional markets.